
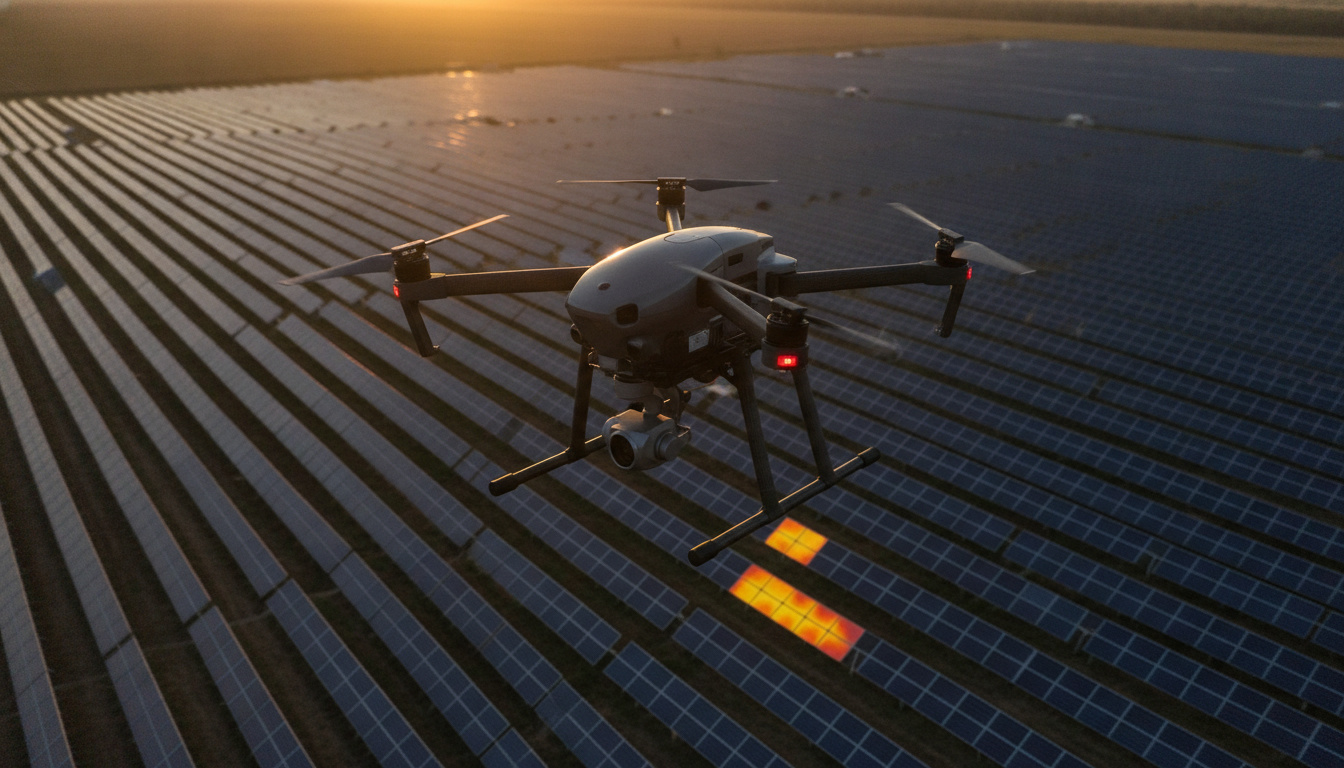
A 250 MW solar farm runs about $3,400 per ground-truthing inspection. The same site, surveyed by drone thermography, runs roughly $480 and finds defects the ground crew physically cannot reach. In 2026 the workflow has matured past the point where any operator with more than ~50 MW of installed capacity is still arguing about whether drone thermography works. They are arguing about GSD targets, dock placement, and how to feed defects into the repair queue.
Why utility-scale solar moved to drone thermography
Three forces pushed utility solar to drone thermography between 2020 and 2025. First, the operators got bigger — Germany’s EnBW grew from 150 MW to 1 GW in four years (a 567% expansion no consultant-led program could scale to match). Second, defect-detection AI caught up — the IEEE Journal of Photovoltaics’ 2025 benchmark study puts automated aerial thermal classification at 88–98% accuracy depending on architecture. Third, the cameras came down in price — the DJI Matrice 30T Dock Version that flew the 181 MWDC Texas site in 2023 ships with a 640×512 radiometric thermal sensor and an RGB camera in a single integrated payload, no FLIR add-on. The Texas case study shows the entire capture-and-process loop on that one airframe.
EnBW’s Technical Specialist for PV Modules, Timo Freund, put it plainly: “We now have way more solar farms to inspect, and each farm is bigger than before — but we can’t hire 7× more people to inspect them all.”
The three-site workflow: DJI Dock 181 MW, EnBW 1 GW, Impact Aerial 100 MW
The three operators below were selected because each has published verifiable capture-rate, defect-rate, and equipment numbers — not vendor decks, but post-deployment write-ups by the operators themselves.
DJI Dock at a 181 MWDC Texas farm (2023)
DJI Enterprise’s May 2023 case write-up documents the first commercial solar inspection flown by a DJI Dock in North America. The deployment covered the entire 181 MWDC site using a Matrice 30T Dock Version paired with DJI FlightHub 2 for flight management and Raptor Maps for analytics processing. Mission planning ran on Raptor Maps’ standard preventative-maintenance profile: 5.5 cm/px thermal resolution at a 40-meter flight height, 70% front overlap and 20% side overlap, 5.5 m/s capture speed with a 2-second photo interval. Round-trip flights to inverter blocks ranged from 3 to 9 minutes (10–30% of battery), and the team demonstrated 2.5 km reach (5 km round-trip) from the dock. Capture rate at Raptor Standard settings hit 5 MW per hour conservatively and 7 MW per hour at peak — meaning the full 181 MW farm took roughly 6 working days at 6 hours of flight per day. Cost savings from removing the on-site pilot’s ancillary data capture ran about $12,000 per year, separate from the inspection-line savings.
EnBW’s autonomous dock program across 1 GW of German solar (2026)
The FlytBase case study on EnBW (interview with Timo Freund, March 2026) is the most detailed operator breakdown publicly available. EnBW runs DJI Dock 2 systems with LTE dongles — the LTE piece was a critical unlock because Germany’s mountainous solar sites have up to 80 m of elevation change plus tree obstructions, and the older Dock 1 relied on line-of-sight comms. Each dock sits at a site sized between 20 and 70 MW (the threshold where inspection flexibility justifies the capex). Flight is operated remotely from EnBW’s Stuttgart headquarters; missions are programmed one day ahead and triggered the morning of. Missions need a minimum 600 W/m² solar irradiance for accurate thermal capture; the operator checks airspace and curtailment status before launching. The capture spec is 25 m altitude, 3 cm ground sample distance (GSD), 70% front / 30% side overlap — note that 3 cm GSD is the resolution mandated by Fraunhofer ISE norms for warranty-grade PV inspections, so EnBW’s spec is regulator-aligned, not arbitrary. Aircraft are DJI Matrice 4T or 4TD with thermal cameras. Analytics runs through Sitemark’s platform, which detects hotspots, string failures, bypass diode failures, and glass breakage, GPS-tagged to the module. Result: inspection frequency moved from annual to quarterly — a 2–4× increase — without adding headcount.
Impact Aerial at 100 MW of UK solar (2025)
The Impact Aerial case write-up from August 2025 covers a UK operator running DJI Matrice M30T surveys on sites up to 100 MW. Same defect categories EnBW catches (hot spots, string failures, soiling); same financial framing — a small percentage of underperforming panels on a 100 MW site is large enough to make even an expensive drone survey pay back in months. Useful for operators considering in-house programs at the 50–100 MW tier.
Equipment: DJI M30T and M4TD, and what each payload actually costs
Across all three operator write-ups, the airframes cluster around two DJI platforms. The DJI Matrice 30T (M30T) is the older workhorse: radiometric 640×512 thermal sensor, 48 MP RGB, IP55, 41-min flight. The DJI Matrice 4T/4TD is the newer generation EnBW has standardized on, with higher-resolution thermal and improved radiometric accuracy. Both integrate with FlightHub 2; both are dock-compatible.
For non-DJI alternatives at smaller scale, the drone thermal camera comparison post covers the FLIR-vs-DJI-vs-Autel landscape, but for utility-scale work in 2026 the M30T/M4TD is the de facto standard. The bigger procurement decision is the dock itself: DJI Dock 2 (with LTE, the EnBW configuration) is a meaningful step up from Dock 1, and the capital case only closes at the 20 MW site-size threshold.
Mission planning: 5.5 cm/px GSD, 70/20 overlap, 40m altitude
Mission planning is where the workflow actually pays you back or eats your margin. The DJI Texas case used Raptor Maps’ standard preventative-maintenance profile — 5.5 cm/px thermal GSD at 40 m flight height, 70% front / 20% side overlap, gimbal pitch set to match the panel tilt. EnBW’s spec is stricter: 3 cm GSD at 25 m altitude, 70/30 overlap, with the 3 cm GSD required to meet Fraunhofer ISE’s warranty-grade PV inspection norm. Both are real published profiles, not marketing copy.
Two operational details that don’t make it into vendor decks: the thermal GSD requirement drives altitude, not the other way around — operators fly as high as they can while still hitting GSD, because every 10 m of extra altitude widens the safety margin over panel rows. The gimbal pitch also needs to follow the panel tilt (fixed-tilt sites run 25–35°, single-axis trackers move); getting this wrong turns the thermal image into a smear.
Defect categories: what thermal cameras actually catch
Defect categories a 640×512-class thermal sensor can resolve at 5 cm GSD:

- Hot spots from cell-level defects — single-cell reverse bias or PID (potential-induced degradation). Smallest signature; needs ≤5 cm GSD to resolve.
- Bypass diode failures — when the diode that protects a substring shorts, the whole substring shows up as a hot linear feature. Easy to spot at any GSD.
- String failures — entire strings offline. At ≤5 cm GSD these show up as clean linear hot strips; the failure is also visible in inverter telemetry, but the thermal pinpoint tells you which module.
- Soiling and shading — cooler (not hotter) than the rest of the panel because the cell is producing less. Requires cross-correlation with visual to distinguish from vegetation shading vs electrical faults (EnBW specifically calls this out as the AI’s job).
- Junction box failures — solder bond degradation shows up as a localized hotspot at the junction box, distinctive from cell-level defects.
- Glass breakage and delamination — usually visible on the RGB layer, but the thermal signature (cooler cells behind cracked glass) flags them even when the crack isn’t photogenic.
Perry et al. (2024) at NREL ground-truthed this taxonomy against production data across 12 US sites using Zeitview’s Solar Insights platform. Short-term recoverable defects (stuck trackers, offline strings) correlate strongly with AC power time series: when 80%+ of modules in an inverter block are flagged, the block typically stops producing. Long-term multi-hotspot defects were generally too infrequent to correlate with system-wide degradation, though one system showed a near-significant relationship between multi-hotspot defects and increased degradation rates. The takeaway: prioritize string failures and stuck trackers first; panel-level hotspot repair is a longer-term yield play.
From thermography to repair order: the data-to-workflow handoff
Capturing the thermal data is the easy part. The hard part is getting it into a maintenance worker’s hands in a form they can act on. Three operators here have converged on the same answer: a digital-twin platform with module-level geo-referencing of every detected anomaly.
DJI’s Texas case pushed imagery to Raptor Maps (geo-references temperature deltas to a digital twin). EnBW runs Sitemark (auto-detects hotspots, string failures, bypass diode failures, glass breakage; GPS-tags each detection). SenseHawk’s TaskMapper takes the same approach with a mobile field app and digital inspection forms. All three turn a thermal image into (module_id, defect_type, severity) tuples a maintenance tech can navigate to without a paper map.
The cross-correlation between visual and thermal imagery is what makes the AI useful in practice — EnBW specifically calls out that the AI distinguishes vegetation shading from electrical failures, reducing false positives without missing genuine issues. Without that cross-correlation, a thermal-only survey flags every shadow as a candidate defect, and the maintenance team gets buried in noise.
ROI math: per-MW cost, breakeven, and the lost-generation variable
SolarThermography.com’s pricing breakdown gives the most transparent range in the public sources: full-service outsourced inspection runs $150/MW for large repeat contracts and climbs above $600/MW for single-site rush jobs; analysis-only (where you fly and the vendor analyzes) costs a fraction of that. Per-MW rates drop with scale. Difficult terrain, vegetation, restricted airspace, and security add 30–80%; FAA Part 107 waiver costs are a pass-through.
Breakeven for an in-house program is the threshold where owning equipment beats contracting — industry consensus puts that at 20–40 MW of annual inspection capacity. Below 20 MW, the equipment sits idle; above 40 MW, contracted per-MW cost exceeds amortized equipment + software. EnBW’s dock-siting decision (20–70 MW per dock) lands inside that range.
Skylark Drones frames the real cost as the revenue lost between defect detection and repair, not the inspection itself. A string that fails in June and gets repaired in October costs four months of generation. Drone thermography compresses the detection cycle from “manual survey at end of season” to “detect this week, dispatch next week.” Worked example: a 100 MW farm at 25% capacity factor produces ~219,000 MWh/yr; at a $50/MWh PPA that’s $10.95M annual revenue, ~$30K per day. A single undetected 1 MW string failure for 90 days costs $90K — more than the entire annual inspection budget for a 100 MW farm.
FAA Part 107 and the BVLOS waiver path for routine solar work
Under default Part 107, a drone has to stay within visual line of sight (VLOS), so routine multi-MW solar surveys are either flown in tedious grid patterns or under a site-specific BVLOS waiver. The FAA’s Florida Power & Light environmental assessment for BVLOS solar drone operations is a useful precedent document — 400 ft AGL cap, Class G airspace preference, visual observer or detect-and-avoid requirements, site-specific approval.
The first FAA BVLOS waiver specifically for solar farm drone inspections was issued to InDro Robotics in February 2023, and is documented in sUAS News and Drone DJ. The waiver established the precedent that routine solar inspection work qualifies for BVLOS authority when the operator demonstrates an equivalent level of safety. Operators entering this market in 2026 should expect a 3–6 month waiver timeline and should plan around it — getting the BVLOS authority before the first commercial engagement is the move. For the broader regulatory landscape, the BVLOS Drone Operations 2026 post and the Part 107 BVLOS waivers in 2026 post walk through the Part 108 NPRM context, but for solar-specific work the InDro precedent and the FPL EA are the two primary-source documents.
For Part 107 basics — the cert itself, the study materials, the TRUST certificate for recreational ops — the canonical reference on this site is the Complete FAA Part 107 Guide for 2026. For the business case (insurance, operating budget, what to charge per MW), Part 107 Business Costs: The 2026 Operating Budget and Do You Need Drone Insurance? are the matching references.
FAQ: drone solar farm inspection in 2026
How much does a drone solar farm inspection cost per MW?
Full-service outsourced inspection runs $150–$600+ per MW, with the low end for large repeat contracts and the high end for single-site rush jobs. “Analysis-only” — where you fly and the vendor analyzes — costs less. The per-MW rate drops with scale, and difficult terrain, vegetation, restricted airspace, or security requirements add 30–80%.
What resolution (GSD) do you need to find real defects?
Cell-level defects need ≤5 cm thermal GSD to resolve reliably. Junction-box and string-level defects are visible at coarser GSD. Fraunhofer ISE’s warranty-grade PV inspection norm mandates 3 cm GSD, which is the spec EnBW’s German fleet runs at. For preventative maintenance without warranty-grade documentation, 5–6 cm GSD (the Raptor Maps standard) is the industry consensus.
Can a drone fly BVLOS over a solar farm under FAA Part 107?
Not under default Part 107, which requires visual line of sight. Routine BVLOS solar work requires a site-specific FAA waiver. The first such waiver for solar farm inspections was issued to InDro Robotics in February 2023, with a 400 ft AGL cap, Class G airspace preference, and visual observer or detect-and-avoid requirements.
How long does it take to inspect 100 MW of solar panels?
At the DJI Dock’s measured capture rate of 5–7 MW per hour with 6 hours of usable flight per day, a 100 MW farm takes roughly 3–4 working days. EnBW’s program runs at similar throughput. The bottleneck is irradiance — thermal capture needs at least 600 W/m² solar irradiance, which constrains flight to mid-day windows in most climates.
Do drones find defects ground crews miss?
Yes. Drone thermography inspects 100% of modules in a single flight; ground-truthing by walking the rows physically samples at best 5–10%. Operator-reported defect catch rates on previously-inspected sites run from 30% to over 50% more defects detected by drone versus sampling-based ground inspection, with the variance driven by site age, soiling, and how recently the ground crew had walked the rows. NREL’s Perry et al. (2024) study is the academic ground-truth: defects flagged by aerial IR thermography directly correlate with AC power production drops at the inverter-block level when 80%+ of modules in a block are flagged.
Is solar farm drone work a viable commercial drone business in 2026?
Yes, with the usual caveats. Per-MW pricing has compressed as more operators have entered the market, but the inspection frequency has expanded from annual to quarterly — EnBW’s 2–4× frequency increase — which means the total addressable market has grown faster than per-unit pricing has dropped. Operators considering this vertical should target the 50–200 MW farm tier where the per-MW economics still support a small drone-services business, and plan on building the analytics capability in-house rather than outsourcing the processing layer.
What software processes the thermal imagery?
The four platforms the operator write-ups name are DJI FlightHub 2 (flight management only — no analytics), Raptor Maps (analytics, the DJI Texas deployment), Sitemark (analytics, the EnBW deployment), and SenseHawk TaskMapper (digital-twin platform with analytics and field app). The photogrammetry stack itself — Pix4Dmatic, RealityScan, WebODM, DJI Terra — is covered in the Best Drone Mapping Software 2026 post, but for solar thermography specifically the analytics layers above are the working toolchain, not the photogrammetry stack.
Sources and methodology
All numeric claims in this article trace back to one of the following primary sources. Operator write-ups are post-deployment case studies published by the operators or their platform vendors; the academic references are peer-reviewed conference papers indexed in IEEE Xplore or NREL’s OSTI repository.
- DJI Enterprise (May 2023): “Important Takeaways from Inspecting a 181 MWDC Solar Farm with DJI Dock.” https://enterprise-insights.dji.com/blog/dji-dock-solar-inspection-lessons-learned
- FlytBase (March 2026): “How EnBW Scaled Solar PV Inspections from 150 MW to 1 GW Using Autonomous Drone Docks.” https://flytbase.com/case-studies/enbw-scaled-solar-pv-inspections-150-mw-to-1-gw-autonomous-drone-docks
- Impact Aerial (August 2025): “Harnessing the Power of Thermal Drone Technology for 100MW Solar Farm Surveys.” https://www.impactaerial.co.uk/2025/08/21/harnessing-the-power-of-thermal-drone-technology-for-100mw-solar-farm-surveys/
- SolarThermography.com (June 2026): “Solar Farm Thermography Survey Cost & ROI.” https://solarthermography.com/blog/solar-inspection-roi/
- Perry, K., Nguyen, Q., Jordan, D., Deline, C., Putrah, B. (June 2024): “Relating Aerial Infrared Thermography Defects to Photovoltaic Performance,” IEEE PVSC. https://www.osti.gov/biblio/2382803
- Aarseth, B.L., Nygard, M.M., Otnes, G., Marstein, E.S. (November 2024): “Combining Production Data Timeseries and Infrared Thermography to Assess the Impact of Thermal Signatures on Photovoltaic Yield Over Time,” IEEE Journal of Photovoltaics. https://doi.org/10.1109/jphotov.2024.3483248
- Lofstad-Lie, V., Simonsen, A.S., Nygaard, T.F., Marstein, E.S. (July 2025): “Data Quality Analyses for Automatic Aerial Thermography Inspection of PV Power Plants,” IEEE Journal of Photovoltaics. https://doi.org/10.1109/jphotov.2025.3587297
- FAA: “Final Environmental Assessment for Issuing a Certificate of Waiver to Florida Power & Light Company for Drone Operations in Florida.” https://www.faa.gov/sites/faa.gov/files/FAA-Final-EA_FPL-Waiver-for-FL-Drone-Operations.pdf
- sUAS News (February 2023): “InDro obtains FAA BVLOS waiver for solar farm inspections.” https://www.suasnews.com/2023/02/indro-obtains-faa-bvlos-waiver-for-solar-farm-inspections/
- Skylark Drones (2026): “Solar Inspection Turnaround: The Hidden Revenue Variable.” https://skylarkdrones.com/blog/solar-inspection-turnaround-time-business-impact
Methodology note: Per-MW cost figures are from SolarThermography.com’s pricing breakdown (representative, vary by region). Defect-detection accuracy ranges (88–98%) are aggregated from peer-reviewed studies; the figure depends on architecture and resolution. The “30–50% more defects caught” claim is operator-reported, not independently ground-truthed.
{ “@context”: “https://schema.org”, “@type”: “Article”, “headline”: “Drone Solar Farm Inspection in 2026: The Workflow That Pays for Itself”, “datePublished”: “2026-08-01”, “dateModified”: “2026-08-01”, “author”: { “@type”: “Organization”, “name”: “dronesera.com”, “url”: “https://dronesera.com” }, “publisher”: { “@type”: “Organization”, “name”: “dronesera.com”, “logo”: { “@type”: “ImageObject”, “url”: “https://dronesera.com/wp-content/uploads/2026/06/site_logo_dronesera_2026.png” } }, “image”: “https://dronesera.com/wp-content/uploads/2026/08/drone-solar-farm-inspection-2026-hero.png”, “mainEntityOfPage”: { “@type”: “WebPage”, “@id”: “https://dronesera.com/drone-solar-farm-inspection-2026-workflow-roi/” }, “description”: “Drone solar farm inspection in 2026: three operator workflows, equipment choices, GSD math, ROI breakdown, and FAA BVLOS waiver path. See the workflow now.” } { “@context”: “https://schema.org”, “@type”: “FAQPage”, “mainEntity”: [ { “@type”: “Question”, “name”: “How much does a drone solar farm inspection cost per MW?”, “acceptedAnswer”: { “@type”: “Answer”, “text”: “Full-service outsourced inspection runs $150-$600+ per MW, with the low end for large repeat contracts and the high end for single-site rush jobs. Analysis-only (where you fly and the vendor analyzes) costs less. The per-MW rate drops with scale, and difficult terrain, vegetation, restricted airspace, or security requirements add 30-80%.” } }, { “@type”: “Question”, “name”: “What resolution (GSD) do you need to find real defects?”, “acceptedAnswer”: { “@type”: “Answer”, “text”: “Cell-level defects need 5 cm thermal GSD or finer to resolve reliably. Junction-box and string-level defects are visible at coarser GSD. Fraunhofer ISE’s warranty-grade PV inspection norm mandates 3 cm GSD, which is the spec EnBW’s German fleet runs at. For preventative maintenance without warranty-grade documentation, 5-6 cm GSD (the Raptor Maps standard) is the industry consensus.” } }, { “@type”: “Question”, “name”: “Can a drone fly BVLOS over a solar farm under FAA Part 107?”, “acceptedAnswer”: { “@type”: “Answer”, “text”: “Not under default Part 107, which requires visual line of sight. Routine BVLOS solar work requires a site-specific FAA waiver. The first such waiver for solar farm inspections was issued to InDro Robotics in February 2023, with a 400 ft AGL cap, Class G airspace preference, and visual observer or detect-and-avoid requirements.” } }, { “@type”: “Question”, “name”: “How long does it take to inspect 100 MW of solar panels?”, “acceptedAnswer”: { “@type”: “Answer”, “text”: “At the DJI Dock’s measured capture rate of 5-7 MW per hour with 6 hours of usable flight per day, a 100 MW farm takes roughly 3-4 working days. EnBW’s program runs at similar throughput. The bottleneck is irradiance – thermal capture needs at least 600 W/m2 solar irradiance, which constrains flight to mid-day windows in most climates.” } }, { “@type”: “Question”, “name”: “Do drones find defects ground crews miss?”, “acceptedAnswer”: { “@type”: “Answer”, “text”: “Yes. Drone thermography inspects 100% of modules in a single flight; ground-truthing by walking the rows physically samples at best 5-10%. Operator-reported defect catch rates on previously-inspected sites run from 30% to over 50% more defects detected by drone versus sampling-based ground inspection, with the variance driven by site age, soiling, and how recently the ground crew had walked the rows. NREL’s Perry et al. (2024) study is the academic ground-truth: defects flagged by aerial IR thermography directly correlate with AC power production drops at the inverter-block level when 80%+ of modules in a block are flagged.” } }, { “@type”: “Question”, “name”: “Is solar farm drone work a viable commercial drone business in 2026?”, “acceptedAnswer”: { “@type”: “Answer”, “text”: “Yes, with the usual caveats. Per-MW pricing has compressed as more operators have entered the market, but the inspection frequency has expanded from annual to quarterly – EnBW’s 2-4x frequency increase – which means the total addressable market has grown faster than per-unit pricing has dropped. Operators considering this vertical should target the 50-200 MW farm tier where the per-MW economics still support a small drone-services business, and plan on building the analytics capability in-house rather than outsourcing the processing layer.” } }, { “@type”: “Question”, “name”: “What software processes the thermal imagery?”, “acceptedAnswer”: { “@type”: “Answer”, “text”: “The four platforms the operator write-ups name are DJI FlightHub 2 (flight management only – no analytics), Raptor Maps (analytics, the DJI Texas deployment), Sitemark (analytics, the EnBW deployment), and SenseHawk TaskMapper (digital-twin platform with analytics and field app). The photogrammetry stack itself – Pix4Dmatic, RealityScan, WebODM, DJI Terra – is covered in the Best Drone Mapping Software 2026 post, but for solar thermography specifically the analytics layers above are the working toolchain, not the photogrammetry stack.” } } ] } { “@context”: “https://schema.org”, “@type”: “WebPage”, “name”: “Drone Solar Farm Inspection in 2026: The Workflow That Pays for Itself”, “speakable”: { “@type”: “SpeakableSpecification”, “cssSelector”: [ “.solar-intro” ] } }