
By Focus, Dronesera public-data research editor. Research performed on 10 October 2026 using FAA workbooks and forecast documents. This is desk analysis, not a flight test or a survey of working pilots; no professional licence or academic credential is claimed for the byline.
I rebuilt the Part 107 remote pilot time series because the familiar headline, almost half a million pilots, hides several different measurements. I downloaded ten annual FAA Civil Airmen Statistics workbooks, extracted certificates held and original certificates issued, and checked those rows against the latest historical table. Then I compared that series with the FAA’s 2026 aerospace forecast. The result is a reproducible dataset, three original charts, and a warning about treating certificate growth as employment growth.
In the Civil Airmen Statistics series, certificates held rose from 69,166 at the end of 2017 to 492,311 at the end of 2025. My calculation puts that at 7.12 times the earlier pool. Original certificates issued in a year tell a quieter story: 48,854 in 2017 and 64,880 in 2025, an increase of 32.8%. Both statements can be true because one measures a stock and the other a flow. Neither counts paid flying hours.
I also found that the forecast’s 2025 baseline, 493,396, differs from the workbook’s 492,311. I have not averaged them, relabelled the difference as new pilots, or silently connected the lines. If you are budgeting training or building a business case, that distinction matters more than another rounded growth headline. Our Part 107 operating-budget guide supplies the business context; this study supplies the denominator discipline. The FAA workbook is the main source for the historical findings below.

Research methodology: rebuilding the FAA series
Scope, source versions and collection date
I set the observation window to calendar years 2016 through 2025, with extraction on 10 October 2026. The starting year is deliberately marked partial: the FAA workbook footnote says remote pilot certification began in August 2016. I did not extrapolate its launch-period count into a full year. The 2025 workbook is my main analysis version because it places ten years of historical observations side by side. The FAA Civil Airmen Statistics index provides the annual source files and the administrative context for the series.
I downloaded every annual edition in the window, rather than treating ten columns in one workbook as ten independent sources. The older editions are a version-control check: they allow me to ask whether the displayed historical values agree with the year-specific publication. This is not independent corroboration of the underlying registry. The same agency generated all the files, and a shared upstream error could appear in every copy. My original contribution is the joined extraction, the cross-edition audit, the derived calculations, and the refusal to mix incompatible definitions.
What I extracted and what I did not infer
I used Table 1’s Remote Pilots row for certificates held at year-end, and Table 17’s Remote Pilot Certificates row for original certificates issued during the year. In the latest file these sheets are named T1 and T17; earlier editions use Table 1 and Table 17. I matched sheet and row labels before extracting cells. A positional parser that assumes identical sheet names fails on the older editions. The annual appendix records the latest workbook cell references, while the downloadable audit records the corresponding archive cells and source URLs.
I loaded the spreadsheets with openpyxl in Python, using stored cell values rather than asking a language model to read a screenshot of a graph. I checked that each year header was aligned with the remote-pilot row. For the main series, T1 cells K19 through B19 run from 2016 to 2025; T17 cells K18 through B18 provide the annual issuance observations. I left the launch-year year-on-year change blank because the previous year’s relevant baseline is not supplied. I did not turn a blank or an inapplicable cell into zero.
I extracted a second dataset from Table 12: fifteen age bands across nine published year panels, yielding 135 age-band observations. Those panels cover 2016–2023 and 2025; the supplied Table 12 does not include a 2024 panel, so I did not invent one. For each panel I summed the age bands and required the result to match the year-end total in the main series. I used those totals as the denominator when calculating age shares. That is an internal consistency check, not a claim that the FAA surveyed all pilots’ current occupations. The raw age-band values and workbook coordinates are in the download; the article displays the endpoint distributions so the comparison remains readable.
Calculations and controls
I calculated the annual stock change as this year’s certificates held minus last year’s certificates held. Percentage stock growth is that difference divided by last year’s held count. Annual issuance growth uses the same formula but takes original issuances as its denominator. I kept these two percentages in separate fields. For the longer comparison I used 2017 as the baseline, the first complete calendar year after launch. The compound annual growth calculation spans eight intervals between the end of 2017 and the end of 2025, not nine observations treated as nine intervals.
I also computed a reconciliation residual: stock change minus original certificates issued. This is a diagnostic column, not an attrition estimate. A negative value does not prove a pilot quit; a positive value does not prove a pilot returned to work. Administrative snapshots and processing conventions can differ. The arithmetic tells me where the two published series fail to form a simple ledger. It does not identify the cause. I retained both the negative 2018 residual and the positive 2019 residual rather than smoothing them away to manufacture an orderly cumulative curve.
My cross-edition audit compared each year’s held count and original-issuance count with the corresponding year in the 2025 workbook. All twenty paired comparisons matched in the files retrieved for this study. I saved SHA-256 fingerprints of the downloaded workbooks in the audit JSON so a future reader can detect a replaced source file. Hash agreement identifies a file version; it cannot validate the FAA’s underlying records. The ZIP includes the latest workbook, the joined annual CSV, the age CSV and the calculation/audit JSON.
Keeping the forecast in its own lane
For projections I used the remote-pilot section of the FAA Aerospace Forecast FY2026–2046 emerging-entrants document, printed pages 67–68. I read the accompanying text, not just the rounded chart labels. Its 2025 baseline is 493,396 and its 2030 endpoint is 628,600. I used those printed numbers to recompute endpoint growth. I did not substitute the workbook’s 492,311 into the forecast and present the result as the FAA’s own scenario. The forecast also describes a registration-based assumption and a certificate-overlap share; those remain attributed FAA statements.
I deliberately excluded live counters, job listings, exam-preparation marketing and third-party market-size estimates from the historical dataset. I did not join certificates to individual flight histories, registered aircraft, employers or incident records. This study uses public aggregate tables, not personal registry data, and requires no personal identifiers. The collection equipment was a Linux workstation, Python, openpyxl and matplotlib; there were no airframes, environmental controls, flight instruments or survey participants. For the practical distinction between credentials and mission permissions, I refer readers to our pilot-certification comparison, not an invented test programme.
Finding 1: the certificate pool grew much faster than annual entry
I get a 7.12-fold increase in certificates held between the first full post-launch year and 2025. The corresponding compound annual growth rate is 27.8%. That is a calculation on the workbook stock, not the growth rate of drone employment. It is a useful description of how the administrative pool expanded, but it becomes misleading if the word certificates disappears from the sentence. My first chart therefore labels the vertical axis with the thing actually counted.

For annual original certificates, the endpoint increase is only 32.8%. I checked the first complete-year baseline against the 2017 FAA workbook. A growing stock can compound over years while the incoming annual flow moves within a narrower range. That is why comparing two cumulative totals makes the sector look different from comparing annual entry. Neither view should displace the other: I would use held certificates to describe pool size and original issuances to discuss entry into that administrative pool.
I would not use either number to size a local client market. A person can hold a certificate without offering services in your county, and a service business can use more than one credentialed person. Those possibilities are enough to break a one-certificate-equals-one-competitor assumption, even without estimating how common they are. Our commercial pilot income guide addresses the separate question of earnings; the certificate files analysed here contain no pay observations. I cannot use a credential curve to validate an hourly-rate claim.
Finding 2: annual issuance is uneven, not a smooth acceleration
The annual series shows 45,440 original certificates in 2018, 45,673 in 2019, and 46,089 in 2020. It then reaches 48,300 in 2021 and 49,627 in 2022. These are counts from the FAA tables, not estimates interpolated between endpoints. I checked the early plateau against the 2018 archive and the 2019 archive. I can describe the plateau; I cannot identify its economic cause from these rows.
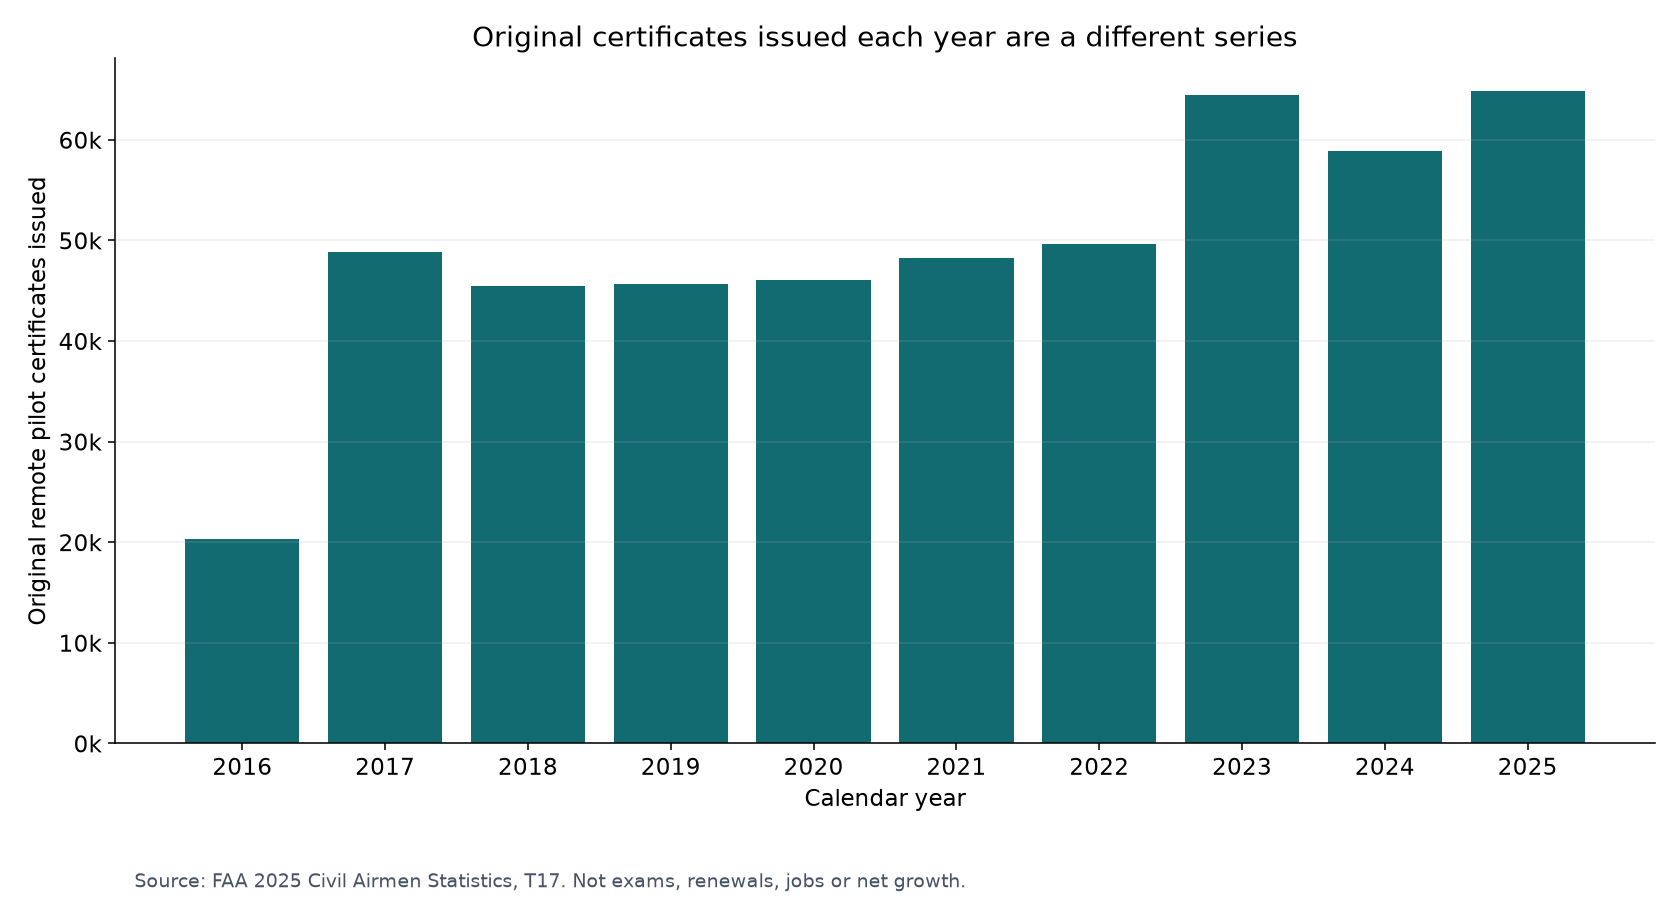
The largest annual issuance jump after the first complete year is in 2023: 64,507 compared with 49,627 in 2022, a 30.0% increase rounded to one decimal place. Issuance then falls to 58,887 in 2024, down 8.7%, before rising to 64,880 in 2025, up 10.2%. The last value is the highest annual issuance count in this window. It is not evidence of an uninterrupted acceleration. I would preserve the intervening decline in any briefing rather than drawing an arrow through it.
I did not attribute those changes to a specific rule, product launch or hiring cycle. A causal claim would require additional evidence about timing, mechanisms and alternative explanations. For operating context, our night-operations guide discusses a different regulatory question. Its subject does not explain the issuance sequence by itself. This is the boundary I want in a useful research pillar: the data can establish a change without pretending to establish why it happened.
Finding 3: net growth is not the same as original issuance
When I reconcile the two rows, most annual differences are small relative to the total stock, but 2018 and 2019 stand out. In 2018 the stock rises by 37,155 while original issuances total 45,440, producing a residual of minus 8,285. In 2019 the stock rises by 53,981 while original issuances total 45,673, producing a residual of plus 8,308. Those observations survive the archive checks. I cannot responsibly call the first number pilot departures and the second number returning pilots.
The later sequence is much closer, but still not an exact ledger. The 2020 workbook gives a stock increase of 46,020 against 46,089 issuances. The 2021 workbook gives 48,265 against 48,300. I retain those differences because a clean-looking spreadsheet is not more trustworthy than a traceable one. The annual appendix includes every residual.
Summing the ten annual original-issuance observations gives 492,619, not the 2025 held count of 492,311. That is another reason I did not rebuild the stock by cumulative addition. The published stock row is the stock series. My reconciliation is a quality-control note, not a replacement series. If I needed a record-level explanation, I would ask the FAA for its accounting definitions and revisions rather than infer them from aggregate arithmetic.
I use the same principle in operational recordkeeping: preserve the original observation separately from later interpretation. Our flight-log evidence checklist explains that discipline in a mission context. Here it means keeping source values, derived columns and unresolved residuals visible. I have not corrected either FAA row merely because the arithmetic is inconvenient.
Finding 4: the forecast baseline cannot be pasted onto this history
The forecast says 493,396 remote pilots at the end of 2025. The Civil Airmen Statistics workbook says 492,311 remote pilot certificates held. The difference is 1,085. I regard this as a source-definition or source-version question to preserve, not a hidden extra year’s growth. The forecast’s graph also prints rounded historical labels of 358 thousand for 2023 and 423 thousand for 2024, while the workbook prints 368,633 and 427,598. Rounding alone does not make those series identical.
| Year | Civil Airmen Statistics | Forecast publication |
|---|---|---|
| 2023 | 368,633 held | 358 thousand, rounded graph label |
| 2024 | 427,598 held | 423 thousand, rounded graph label |
| 2025 | 492,311 held | 493,396, printed forecast baseline |
| 2030 | Not observed | 628,600, projected endpoint |
The forecast footnote explicitly discusses data cleanup, including duplicate records and incorrect entries noticed during renewal. That is a stated reason its own figures can change between forecast editions. It does not supply a record-by-record reconciliation with Civil Airmen Statistics. I therefore attribute the cleanup statement to the FAA and leave the inter-publication discrepancy unresolved. I checked the workbook’s 2023 value against the 2023 annual edition; the agreement supports the extraction, not a theory about the forecast.
My recommendation is simple: pick a series according to the question, label it, and keep its baseline. If you want historical certificate accounting, use the workbook. If you want the FAA’s modelled future scenario, use the forecast and its assumptions. Do not build a smooth line that quietly switches from one to the other. That same caution applies when reading our UTM and advanced-air-mobility field guide: a forecast is a conditional planning input, not a completed operational measurement.
Finding 5: certificate overlap and recent entry are different populations
The FAA forecast states that 78.0% of remote pilots have only a Part 107 remote pilot certificate and 22.0% also have a Part 61 pilot certificate. I report those shares as published, rounded estimates for the forecast population. They do not establish that 22% of new certificates in 2025 used the Part 61 route. A cross-sectional overlap share and an annual certification-pathway share have different denominators. I did not multiply 22% by the workbook’s annual issuance total to manufacture a Part 61 entrant count.
There is a further tempting error when reading Table 16, the certificate-issuance breakdown. It reports 64,107 remote-pilot original issues by CFI and another 773 original issuances, comprising 126 under Examiner and 647 under Inspector. Together those categories total 64,880. They are not labelled Part 107-only and Part 61-overlap. I can reproduce the sum; I cannot use these administrative categories to establish applicant-pathway shares. The Table 16 headings and notes control the interpretation, not a plausible story about how certificates are obtained.
For the actual application distinction, the FAA’s becoming-a-drone-pilot guidance separates first-time applicants from existing Part 61 certificate holders who meet the stated conditions. That guidance explains a process, not the proportion of the historical pool using each route in every year. I would verify current eligibility against the FAA before applying it to an individual. Our controlled-airspace authorization guide covers another distinct requirement: a credential does not settle permission for a particular flight.
Finding 6: the age mix changed less than the total count suggests
I expected the greatly expanded pool to make the endpoint age shares more dramatic than they are. Summing Table 12’s bands below age 30 gives 3,999 certificates in 2016 and 96,470 in 2025. As proportions of each year’s total, those are 19.64% and 19.60%. Summing ages 60 and above gives 2,838 and 68,169, or 13.94% and 13.85%. The counts grew substantially while these broad shares remained similar. The chart uses percentages so the total expansion does not obscure that comparison.
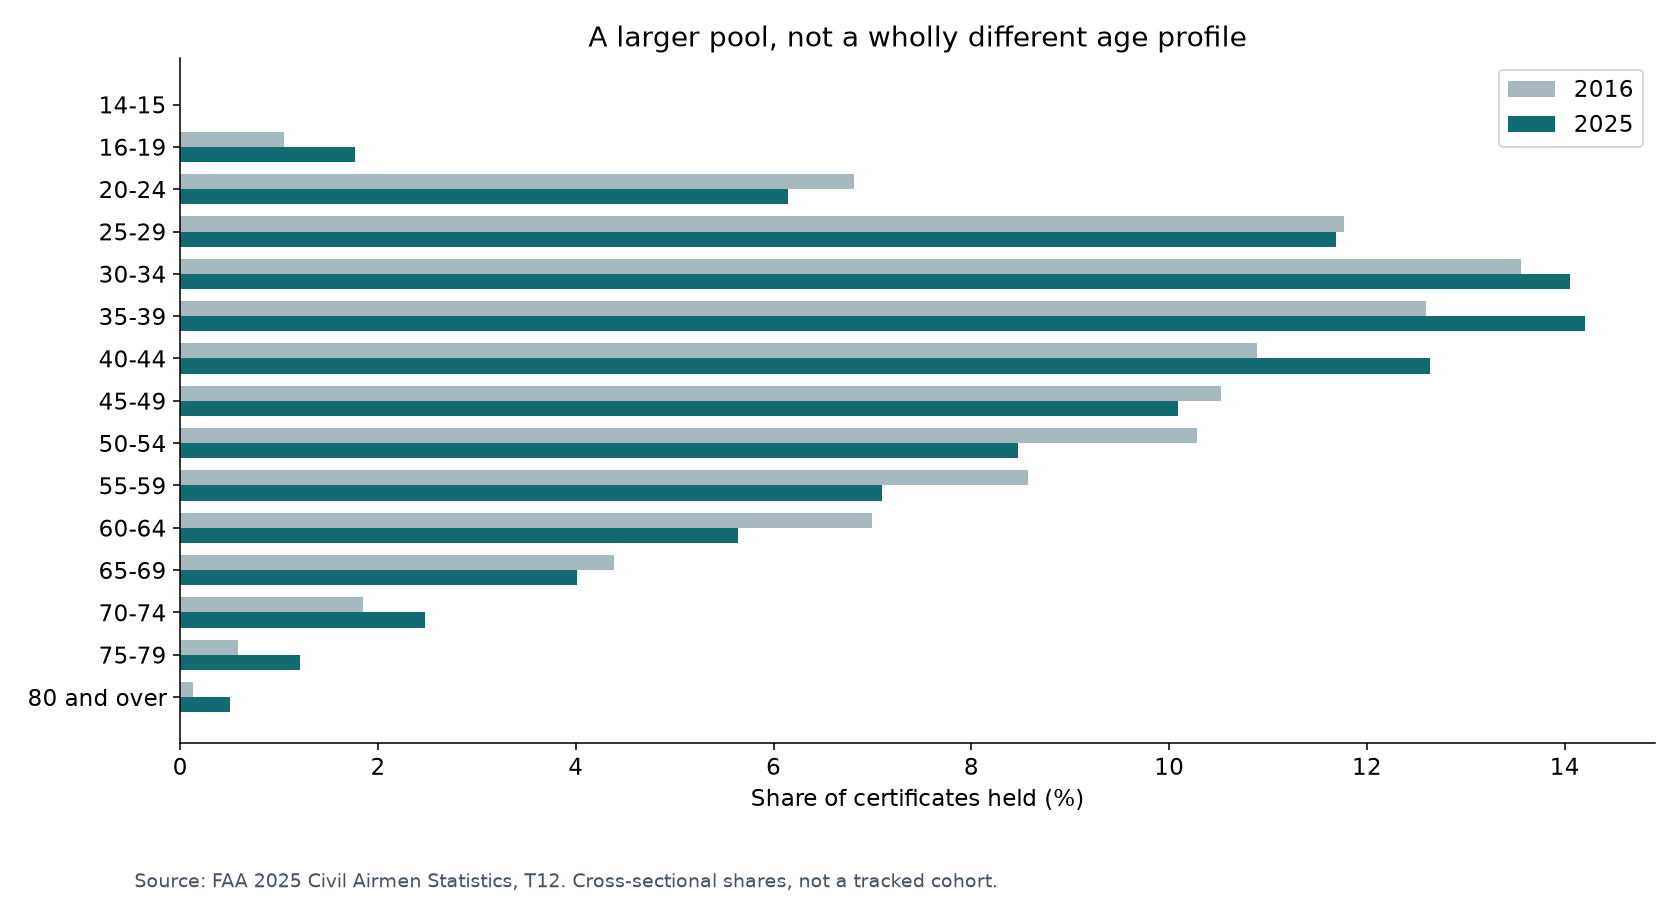
I would not generalize this into a claim that the same people stayed in the programme or that age has no effect on entry. The two endpoints are different cross-sections; I did not track an individual cohort. Within the broad groups the fifteen-band table shows changes, and a stable combined share can hide them. I retain every band in the endpoint appendix and all nine panels in the downloadable CSV. The 2016 launch-year workbook supplies the historical starting publication; the latest file supplies the consistent multi-year age panels used in the calculation.
I also would not use the distribution to recruit only one age group or infer digital proficiency. Certificates held by age are not measured skill, workload, fitness, income or mission suitability. For a hiring decision I would assess the job’s actual evidence requirements. Our newsroom drone operations guide gives one practical mission context. This age chart supplies background about a credential population, not a shortcut for evaluating a newsroom pilot.
Finding 7: the 2030 scenario is not a jobs forecast
Using the forecast’s own printed endpoints, I calculate growth from 493,396 to 628,600 as 27.4%, equivalent to roughly 5.0% compounded per year across five intervals. The difference is 135,204. The FAA text calls this a 28.0% increase and discusses over 135 thousand new remote-pilot opportunities. I preserve the distinction: 27.4% is my arithmetic on its printed numbers, while 28.0% is the document’s stated percentage. I do not repeat either as a measured increase in employed operators.
The forecast’s remote-pilot section says its projection draws on remote-pilot trends, renewal trends and commercial small-UAS registration trends. It assumes the remote-pilot-to-active-Part-107-registration relationship remains at the 2025 level of 1.16. That assumption is the bridge between the modelled fleet and the remote-pilot projection. It is not a measured staffing ratio for a specific delivery company, public-safety agency or mapping crew. I would not divide a firm’s aircraft by 1.16 to decide its headcount.
I read the scenario as a conditional administrative-growth outlook. It does not tell me the share who will work full time, the number of vacancies, the revenue per pilot, the effect of automation on staffing, or the regional allocation of work. It does not certify a future operation. Our BVLOS permissions analysis addresses operating authority separately. My conclusion is narrower than an employment headline but more usable: the FAA expects a larger certificate-related pool under its stated scenario; the business consequences need additional evidence.
Limitations: what this study does not tell you
I analysed aggregate administrative publications, not operational telemetry. I cannot test whether a holder flew in the observation year, how often they flew, what they earned, or which sector they served. The word active in the publication’s title must not become an unsupported claim that every remote-pilot record represents a currently working commercial operator. For an individual compliance decision, I would check the FAA’s remote-pilot guidance and the person’s actual records, not this population table.
I have not resolved the 2018 and 2019 stock-flow residuals or the mismatch between the workbook and forecast. They are disclosed analytical limits. Matching twenty historical values across annual editions reduces the chance of a transcription or sheet-alignment error; it does not establish that the registry has no duplicates, delayed updates or changing conventions. The workbook checks and age-band sums are dependent checks inside an FAA publication system, not an independent census. Future source replacements can change the audit, which is why I saved file fingerprints.
I also did not measure entry by geography, certification pathway, employer, occupation or demographic attribute other than the published age bands. The age comparison is not a longitudinal cohort study. The first year covers only the launch period. The forecast depends on assumptions I have not independently validated. The 2022 annual workbook is part of the version audit, not a substitute for those missing variables. I will not use any of these certificate totals as a safety denominator.
In particular, I have not divided reported drone sightings by certificates held. Sightings can involve unknown operators and uncertain identification; certificates do not measure the number of relevant flights or hours exposed to a hazard. Joining two readily available columns would produce a precise-looking but poorly defined ratio. Our FAA sighting-report recount discusses the report population on its own terms. A legitimate exposure rate would need a matched numerator, an operational denominator and a clearly defined time and population boundary.
Full data appendix and source audit
I include the full ten-year stock-and-flow series below. Percentages are rounded for display; the download retains calculated precision. A dash means no previous baseline is supplied, not zero. The residual equals net stock change minus original certificates issued. The 2024 annual workbook matched both 2024 values in the latest edition, as did the other nine annual checks.
| Year | Held | Original issued | Net change | Stock growth | Residual | T1 / T17 cells |
|---|---|---|---|---|---|---|
| 2016 | 20,362 | 20,362 | — | — | — | K19 / K18 |
| 2017 | 69,166 | 48,854 | 48,804 | 239.7% | -50 | J19 / J18 |
| 2018 | 106,321 | 45,440 | 37,155 | 53.7% | -8,285 | I19 / I18 |
| 2019 | 160,302 | 45,673 | 53,981 | 50.8% | +8,308 | H19 / H18 |
| 2020 | 206,322 | 46,089 | 46,020 | 28.7% | -69 | G19 / G18 |
| 2021 | 254,587 | 48,300 | 48,265 | 23.4% | -35 | F19 / F18 |
| 2022 | 304,256 | 49,627 | 49,669 | 19.5% | +42 | E19 / E18 |
| 2023 | 368,633 | 64,507 | 64,377 | 21.2% | -130 | D19 / D18 |
| 2024 | 427,598 | 58,887 | 58,965 | 16.0% | +78 | C19 / C18 |
| 2025 | 492,311 | 64,880 | 64,713 | 15.1% | -167 | B19 / B18 |
Here are all fifteen age bands for the endpoint comparison. The complete download includes the 135 observations from the nine year panels extracted from Table 12, rather than presenting only the groups that support a convenient headline.
| Age band | 2016 held | 2016 share | 2025 held | 2025 share |
|---|---|---|---|---|
| 14-15 | 0 | 0.00% | 0 | 0.00% |
| 16-19 | 214 | 1.05% | 8,691 | 1.77% |
| 20-24 | 1,388 | 6.82% | 30,244 | 6.14% |
| 25-29 | 2,397 | 11.77% | 57,535 | 11.69% |
| 30-34 | 2,761 | 13.56% | 69,206 | 14.06% |
| 35-39 | 2,564 | 12.59% | 69,911 | 14.20% |
| 40-44 | 2,217 | 10.89% | 62,222 | 12.64% |
| 45-49 | 2,143 | 10.52% | 49,666 | 10.09% |
| 50-54 | 2,094 | 10.28% | 41,714 | 8.47% |
| 55-59 | 1,746 | 8.57% | 34,953 | 7.10% |
| 60-64 | 1,425 | 7.00% | 27,766 | 5.64% |
| 65-69 | 893 | 4.39% | 19,747 | 4.01% |
| 70-74 | 376 | 1.85% | 12,210 | 2.48% |
| 75-79 | 118 | 0.58% | 5,976 | 1.21% |
| 80 and over | 26 | 0.13% | 2,470 | 0.50% |
Get the data: download the FAA remote-pilot analysis ZIP. It contains annual.csv, ages.csv, analysis.json and the 2025 FAA source workbook. The JSON records archive URLs, cell references, source fingerprints, calculations and the retrieval date. I have provided the values necessary to reproduce the published charts, not an undocumented spreadsheet of selected results. The data remains public FAA administrative information; the transformations and interpretation are Dronesera’s.
FAQ: interpreting the Part 107 remote pilot numbers
How many remote pilot certificates were held at the end of 2025?
The FAA 2025 Civil Airmen Statistics workbook reports 492,311. The FAA aerospace forecast uses a separate 2025 baseline of 493,396. I keep those series separate rather than averaging them.
How many original remote pilot certificates were issued in 2025?
Table 17 reports 64,880 original remote pilot certificates issued in 2025. This is an annual flow, not the total certificates held, an exam count, a renewal count or a count of jobs.
Does the certificate total tell me how many pilots are working?
No. My extraction contains no paid hours, employers, revenue or occupational activity. I cannot turn a certificate count into a count of currently working commercial operators.
Why did I start the long-run growth calculation in 2017?
The FAA says certification started in August 2016, so the first observation is a partial launch year. I used the end of 2017 as the first complete-year baseline and eight intervals through the end of 2025.
Can I derive annual issuance by subtracting consecutive totals?
Not reliably. Stock changes and original issuances differ in the published tables. I retain their reconciliation residuals and do not relabel the residuals as departures, renewals or returning pilots.
Does 22% Part 61 overlap mean 22% of new applicants used that route?
No. The forecast describes overlap in its remote-pilot population. It is not an annual applicant-pathway table. I do not apply that percentage to annual original issuances.
Is the FAA projecting 135,204 new jobs by 2030?
The difference between its printed remote-pilot endpoints is 135,204. I treat that as a conditional certificate-related projection, not a measured vacancy or employment count.
Can I calculate a safety rate by dividing sightings by certificates?
No defensible exposure rate follows from that division alone. The numerator and denominator need matched populations and time boundaries, and certificates do not measure flights or flight hours.
Conclusion: use the right denominator before buying the growth story
I found a substantially larger certificate pool, an uneven annual entry flow, and a forecast that must remain separate from the historical workbook. For planning, I would put three labelled lines in the briefing: certificates held, original certificates issued, and the FAA forecast scenario. I would attach the extraction date and source version to each. I would not use the largest of the three as a proxy for paid demand, local competition or safety exposure.
The practical next step is to reproduce the annual table, inspect the two large residuals, and decide which population answers your actual question. If your question is whether to hire or start a service, combine this background with customer evidence and a defensible operating budget. If it is whether your fleet can complete a particular mission, use qualification, permission and operational records. Our fleet-management scaling guide discusses that operational layer. I have kept the claims here smaller than the possible headlines so the resulting dataset is something a practitioner can audit and reuse.
